Dear Jason,
Thank you for your answer, I understand better the damping computation and how I can change them. Sorry for all the help I ask your for, but I have one last thing which annoys me. I was trying to understand why my response tend to be different with my FEM on Matlab, so I’ve made a free vibration test of the 5MW turbine.
The wind load is not considered. Yaw is disabled, rotor speed is 0. The base is fixed, no platform motion.
First fore-aft motion
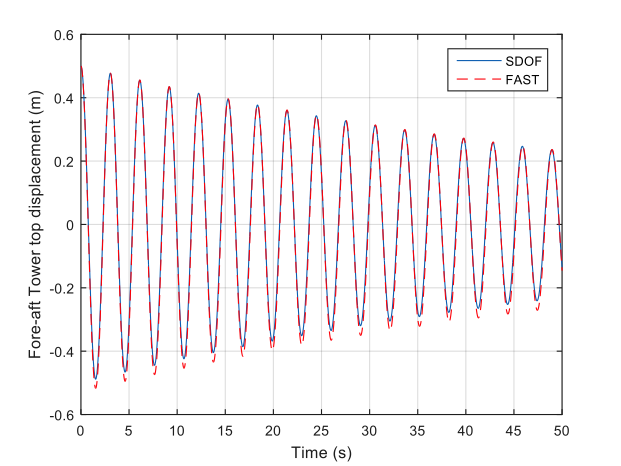
Only the first fore-aft mode is enabled, all other modes are disabled. The initial displacement at the tower top is 0.5m. Damping ratio for the first fore-aft tower mode is 2% of critical. The displacement response is shown in Figure 1. Only a section of the response is shown here. Towards the end, the displacement oscillates about -0.015m level. It would be expected for the displacement to oscillate about 0 level. If we consider the small displacement due to eccentric mass of the rotor, the displacement should be positive. It is not clear why there is this residual negative displacement. When running seismic analysis with 0 initial displacement, the simulated result has a small negative initial displacement, which is also unexpected. It is not clear if the simulation considers the displacement due to gravity loads as the initial condition for simulating seismic response.
Figure 1.
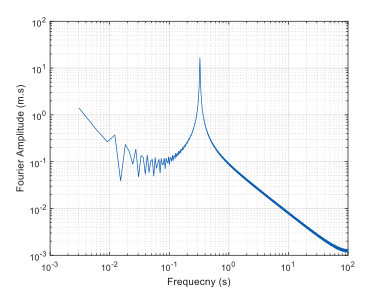
The Fourier Amplitude of displacement is shown in Figure 2. The peak of the spectrum is at 0.327 Hz which is close to the first fore-aft frequency of the tower, as expected.
Figure 2.
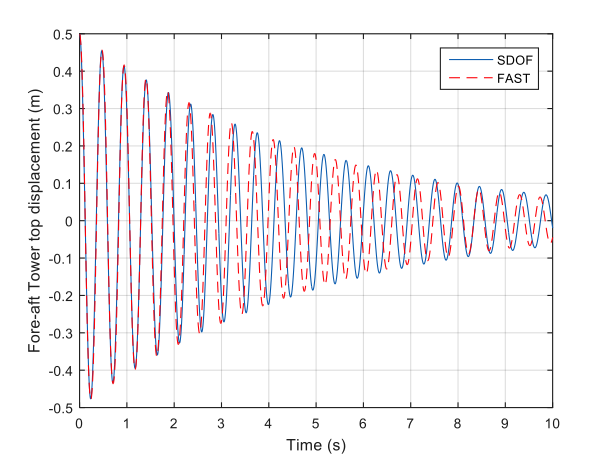
From the computed response, by using the logarithmic decay method, the damping ratio was computed to be 0.75%. This is lower than the uncoupled tower fore-aft first mode damping ratio, which is due to inertia of the nacelle and rotor.
Figure 3 compares the FAST results with a SDOF response with the damping and frequency estimated from the FAST results. The comparison shows that the FAST results matches SDOF response relatively well. However, it is strangely overshoots the negative peaks, but matches the positive peaks. This is also an indication of the negative residual motion at the end of simulation as discussed above.
Figure 3
Second fore-aft mode:
Same analysis as before but only the second fore-aft mode enabled.
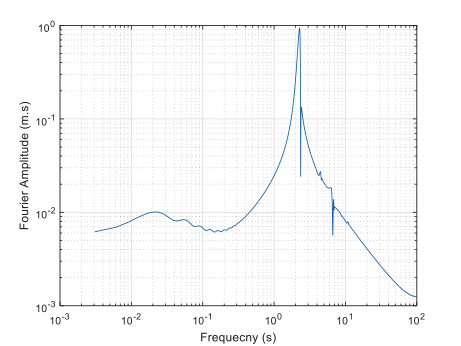
The Fourier Amplitude of the response is shown in Figure 4. It shows multiple peaks, which means that the motion is not harmonic, but contains multiple frequencies, or the frequency is changing in time. The largest peak is at 2.278 Hz, which corresponds to the second fore-aft frequency of the tower. The damping ratio is estimated to be 1.5%. This is twice the damping ratio in the first mode, although same value of 2% was used in FAST for the uncoupled tower. It appears that the difference between the tower damping ratio and the system damping ratio is higher for the first mode, but lower for higher modes, which is expected because of lower mass participation factors of higher modes.
Figure 4
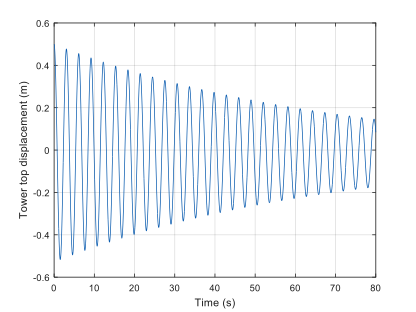
The comparison between the FAST result and an equivalent SDOF is shown in Figure 5. The SDOF frequency is set to 2.13 Hz (different from the second mode frequency of 2.28 Hz) to match the first few peaks of the FAST response. It appears that after a few cycles, the FAST response lags behind the SDOF solution, and at some time the lag is so large that the two responses are out of phase.
Figure 5
The time-frequency plot of the FAST response and equivalent SDOF is shown in Figure 6. The results indicate that as time passes the frequency of FAST response decreases, and the motion is not harmonic as expected. This was unlike the first mode response which was found to be harmonic.
(a) FAST
(b) Harmonic
Figure 6