Like in the previous question we are unsure about when it’s appropriate to use one or the other. If my understanding about fatigue theory is correct the DEL about a fixed mean is the same as a sinusoidal wave with a certain mean stress (L_MF) and an alternate stress (L_MF ± DEL/2) while the diference with the DEL about a zero mean is that there is no mean stress (0 ± DEL/2). I believe that a load with null mean stress causes less damage than another with it. So, is one more conservative than the other?
2- Ultimate Strength and S/N Curve Slopes
According to the article “Model Development and Loads Analysis of an Offshore Wind Turbine on a Tension Leg Platform, with a Comparison to Other Floating Turbine Concepts” in Section 4.3 it is said that no data on the component ultimate strength (LUlt) of the components of NREL’s 5-MW baseline turbine is available. Is it correct to assume that the component’s ultimate strength can be obtained from the extreme loads of the land-based turbine appearing in “Dynamics Modeling and Loads Analysis of an Offshore Floating Wind Turbine” – Appendix F?
The other uncertain factor in the fatigue analysis is the S/N (stress/number of cycles to failure) curve slope m, a material-dependent factor. Commonly, values of m = 3 for steel and m = 10 for composite materials are chosen. However, I’ve read that you can also conduct a parametric study were m varies from m = 3, 4, 5 for the steel components of the tower and LSS and m = 8, 10, 12 for the composite blades. So, which option would you recommend?
3- Aggregate short-term damage-rate
If I want to compute the fatigue damage suffered by the turbine in last year, how should I proceed? I have the wind speed at hub height in hour resolution from the entire 2022. Is the aggregate short-term damage-rate useful in this situation?
MLife can compute DELs with and without the Goodman correction to account for mean loads. When applying the Goodman correction, the load mean can be zero or nonzero. Applying the Goodman correction with a nonzero load mean is the most realistic approach. It is less conservative to assume zero load mean or to neglect the Goodman correction altogether.
If the structural design is solidified and the cross sectional geometry and material properties are known, it should be possible to obtain direct values of LUlt and m. When this is not the case (such as in a conceptual design like for the NREL 5-MW baseline wind turbine, where cross-sectional details are not defined), what we’ve done is to assume that LUlt can be estimated as some multiplier of the extreme loads. Often m has some uncertainty to it, so, a range of values is assumed to assess fatigue sensitivity to the m value.
I’m not sure I fully understand your question, but fatigue will depend on more than just the mean wind speed at hub height with an hour-long resolution (e.g., the turbulence level and shear profile will also be important).
1-I’ve accomplished my parametric study with different values of m (Whöler exponent). The results show that the bigger m is the bigger the DEL become. I think this is the logical result to expect, but I want to make sure I’m correctly interpreting what the Whöler exponent means. In Spanish we use a different nomenclature and I’m not sure I’m correlating well. The Whöler exponent is a material dependent parameter, and its value indicates the slope of the S/N curve diagram. So a material with m=10 like fiberglass means that it can support more fatigue damage than a material with m=3 like steel. Am I right?
2- What I meant with my last question is that I’d like to perform a similar study like the one described in “Extrapolation of Extreme and Fatigue Loads Using Probabilistic Methods”, last chapter, “One-year Simulation”. My limits are that I only have access to data like wind speed at hub height with an hour-long resolution. This study is part of some fatigue preliminary calculations and that’s why I assume stationary conditions (mean wind speed changes each hour but turbulence is not considered during that hour) with a Normal Wind Profile (NWP from IEC 61400-1) considering the change of the shear exponent during each hour (it can be calculated because I also have data of mean wind speed at 10 m).
According to the article I mentioned before, it runs 10 min simulations with a total of 52,596. I don’t know how long the simulations should be in my case and how many should I perform.
A larger value of the Whöler exponent (m) means that for a given load amplitude, it will take more cycles to cause fatigue failure than for a lower value of m.
I’m still not sure how to answer your question. It sounds like you know the mean wind speed and shear exponent, but not the turbulence intensity. Given the large impact of turbulence intensity on fatigue, you would need to estimate turbulence intensity to estimate fatigue.
There is something I don’t quite understand. I’ve finished my parametric study where I analyzed through MLife the effect of the wind shear on short-term DEL. I’ve conducted a series of simulations with different wind shears for the same wind speeds. I’ve plotted the results and I observe a similar behavior in all plots, here is an example:
For m=3 the short-term DEL increase as the wind shear do, just like for the other values of m. When I analyze the Short-term Damage Rate for m=3, 4 or 5 it occurs that it increase with larger values of the short-term DEL just like it is supposed to do. But what I don’t understand is why does the short-term DEL increase with m but it produce less short-term damage rates. Here is the raw data of MLife:
I would expect higher short-term damage rates when the short-term DEL increase but somehow different values of m affect it in a way I don’t understand.
The damage-equivalent load is rising with increasing value of m because the higher-amplitude cycles are more influential for higher values of m than for lower values of m.
The damage rate is dropping with increasing value of m because it takes more cycles to cause fatigue failure for higher values of m than for lower values of m.
Hi Jason.Jonkman,
Is that possible to calculate DEL for a bi-slope steel connection (e.g. m=3 and m=5) with MLife or PyFAST? if I want to implement that to the pyfast fatigue script code, do you have any literature for how to that, like formulas?
Thank you.
Unfortunately, bi-slope SN curves have not been implemented in MLife or pCrunch at the moment. I agree that this would be a good feature to add, but I have not planned out the required formulas myself.
Dear Jason sir,
I am using Mlife to calculate and compare the lifetime fatigue damage of fixed and floating openfast models, I tried calculating the Lult using the method of multiplier to time series maximum value upon the Mextremes calculated value . I am having this doubt," is the LUlt value calculated for YawBrMyn for fixed turbine applicable for the floating turbine as well". I want to calculate the time until failure for these two turbines for my controller.
Best Regards
I would generally expect the loads at the yaw bearing to be a bit different between a fixed-bottom and floating offshore wind system (with the loads from the floating offshore wind turbine being a bit higher). So, if you are calculating LUlt in MLife via scaling of the highest loads, I would not use the loads from the fixed-bottom system for the floating system.
Dear Jason Sir,
Then do you think that if we calculate Lult seperately and calculate the fatigue loads and time until failure for fixed and floating, they are comparable?
I asked so because, currently I adjusted the Lult value and thereby calculated the time until failure for both floating and fixed, so do you recommend same scaling factor be used ,in order for them to comparable. Dont mind if my doubt is trivial. Thanks in advance
Best Regards
Also since I found that the changing of the Lult value can help change the fatigue loads and time until failure. I am unable to figure out what should be done to compare different cases. In one of the older posts, the author said about , setting one of the time until failure to 20yrs by adjusting Lult as a reference and use that Lult value so as to get other time until faiure . Is that recommended?
Thanks in advance.
Best Regards
I would generally recommend to compute LUlt based on the cross-sectional properties of the member, e.g., as discussed in my post dated March 25, 2020 in the following forum topic: Mlife - User Defined Distribution. If that is not possible, scaling LUlt based on the highest load experienced across all load cases is an option.
I have followed your indications to calculate LUlt and multiply by some scaling factors. Like it is said in “Model Development and Loads Analysis of an Offshore Wind Turbine on a Tension Leg Platform, with a Comparison to Other Floating Turbine Concepts” by Denis Matha I chose a final scaling factor of 20 and some values of m to assess the fatigue sensitivity of the m value. I understand that this process is only recommended to compute Damage Equivalent Loads with the Goodman correction. It cannot be used to calculate the damage or the time until failure because the large value of LUlt*20 makes the component stand for hundreds or thousands of years. Am I right?
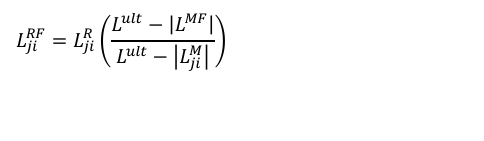
After computing some results in MLife with and without the Goodman correction, I have obtained very similar results. According to the Theory Manual of MLife the definition of the Goodman correction for many input files is:
I don’t understand the fact that if a high value of LUlt is used, the parenthesis tends to one, leaving us with L_RF_ji = L_R_ji, but L_MF is not equal to zero. Does using a high value of LUlt mean neglecting the Goodman correction?
Damage equivalent loads are given as peak-to-valley ranges.

A total of 106560370 samples across 370 files.

A user-supplied joint PDF was used to scale cycle counts over the design lifetime.


Blades  Lifetime DELs at Fixed Mean for various S/N Curves

        m    RootMxc1     RootMyc1     RootMzc1
              (kN-m)       (kN-m)       (kN-m)
 L_Ult         1.51e+05     2.02e+05     2.64e+03
 L_MF               840     5.16e+03        -15.7
        8       5.8e+03     3.81e+03           93
        10     6.11e+03     4.55e+03          103
        12     6.34e+03     5.17e+03          111


Blades  Lifetime DELs without Goodman Correction for various S/N Curves

        m    RootMxc1     RootMyc1     RootMzc1
              (kN-m)       (kN-m)       (kN-m)
 L_Ult         1.51e+05     2.02e+05     2.64e+03
 L_MF                 0            0            0
        8       5.8e+03     3.77e+03         93.4
        10     6.11e+03      4.5e+03          103
        12     6.34e+03     5.12e+03          112


Tower  Lifetime DELs at Fixed Mean for various S/N Curves

        m   TwrBsMxt     TwrBsMyt     TwrBsMzt
             (kN-m)       (kN-m)       (kN-m)
 L_Ult        6.86e+05     2.84e+06     1.91e+05
 L_MF         4.16e+03      4.5e+04         -225
        3     4.57e+03     1.54e+04     1.55e+03
        4     5.91e+03     2.09e+04     1.87e+03
        5     7.15e+03     2.64e+04      2.2e+03


Tower  Lifetime DELs without Goodman Correction for various S/N Curves

        m   TwrBsMxt     TwrBsMyt     TwrBsMzt
             (kN-m)       (kN-m)       (kN-m)
 L_Ult        6.86e+05     2.84e+06     1.91e+05
 L_MF                0            0            0
        3     4.56e+03     1.53e+04     1.55e+03
        4     5.91e+03     2.08e+04     1.86e+03
        5     7.14e+03     2.63e+04      2.2e+03
Regarding (1), I agree. Using an unrealistically high value of LUlt means that the DEL will converge to a given value, but it also means that the damage will be unrealistically low and the time until failure will be unrealistically high. So, it is always more realistic to use a realistic value of LUlt than to set it unrealistically high by scaling the highest load.
Regarding (2), I agree that using an unrealistically high value of LUlt effectively eliminates the Goodman correction because the load means will be much less than LUlt, and thus, not influential.
I’m applying some Damage and Damage Rate calculations on a dynamic yaw case. I apply a simple maneuver where i move from an initial to a final yaw angle in my timeseries and later on study the effects of the different inputs (yaw rate, …) on Damage and Damage Rate.
I namely have a question about the Goodmann correction. I now know how to calculate L ultimate, but how do you chose L_MF?
There were several options explained in the user manual and i understand why you would use them in static cases, but if i have a dynamic case and thus move from an initial to a final yaw angle in my timeseries. What L_MF do i use then? Do i use L_MF = 0?
Already thank you for the help and kind regards,
A. Van Weert
If you are just looking at short-term damage for specific cases, I would probably just use the mean of the specific time series. If you are calculating lifetime damage across many cases, I would probably use the mean over all these cases, consistently across all cases.
Don’t you think it is better to not use the goodman correction, due to the fact that if we want to compare different maneuvers with each other this mean of the specific time series varies. And thus make it not possible to compare different maneuvers.
Example given:
We want to compare the damage and damage rate from a maneuver going from yaw angle 0 degree to 20 degree and want to compare this with another maneuver but now going from 10 to 30 degree.
Also another little question: Is it true that if you want to get the ultimate load L_ult of a conceptual design (like the NREL 5MW baseline) it is recommended to take the extreme event load and multiply it by factor 20.
I read that this will give unrealistic low damages and a high lifetime, but i most likely will compare the damage with a reference case (and thus normalize it).
I guess whether or not you use the Goodman correction depends on how accurate the correction is. And you can always apply the Goodman correction to a fixed mean load of zero.
I agree that assuming L_ult is a larger muitiple of the highest load will skew the damage, but the damage will also converge for higher and higher multiples, which may not matter if you are only comparing normalized damage anyway.