Dear all,
I am using ACDC (Automated Campbell Diagram Code) to generate Campbell diagrams for modal analysis of my OpenFAST case, but I’ve encountered a few problems and really need some help.
1. Confusion about Line and Mode Generation Logic
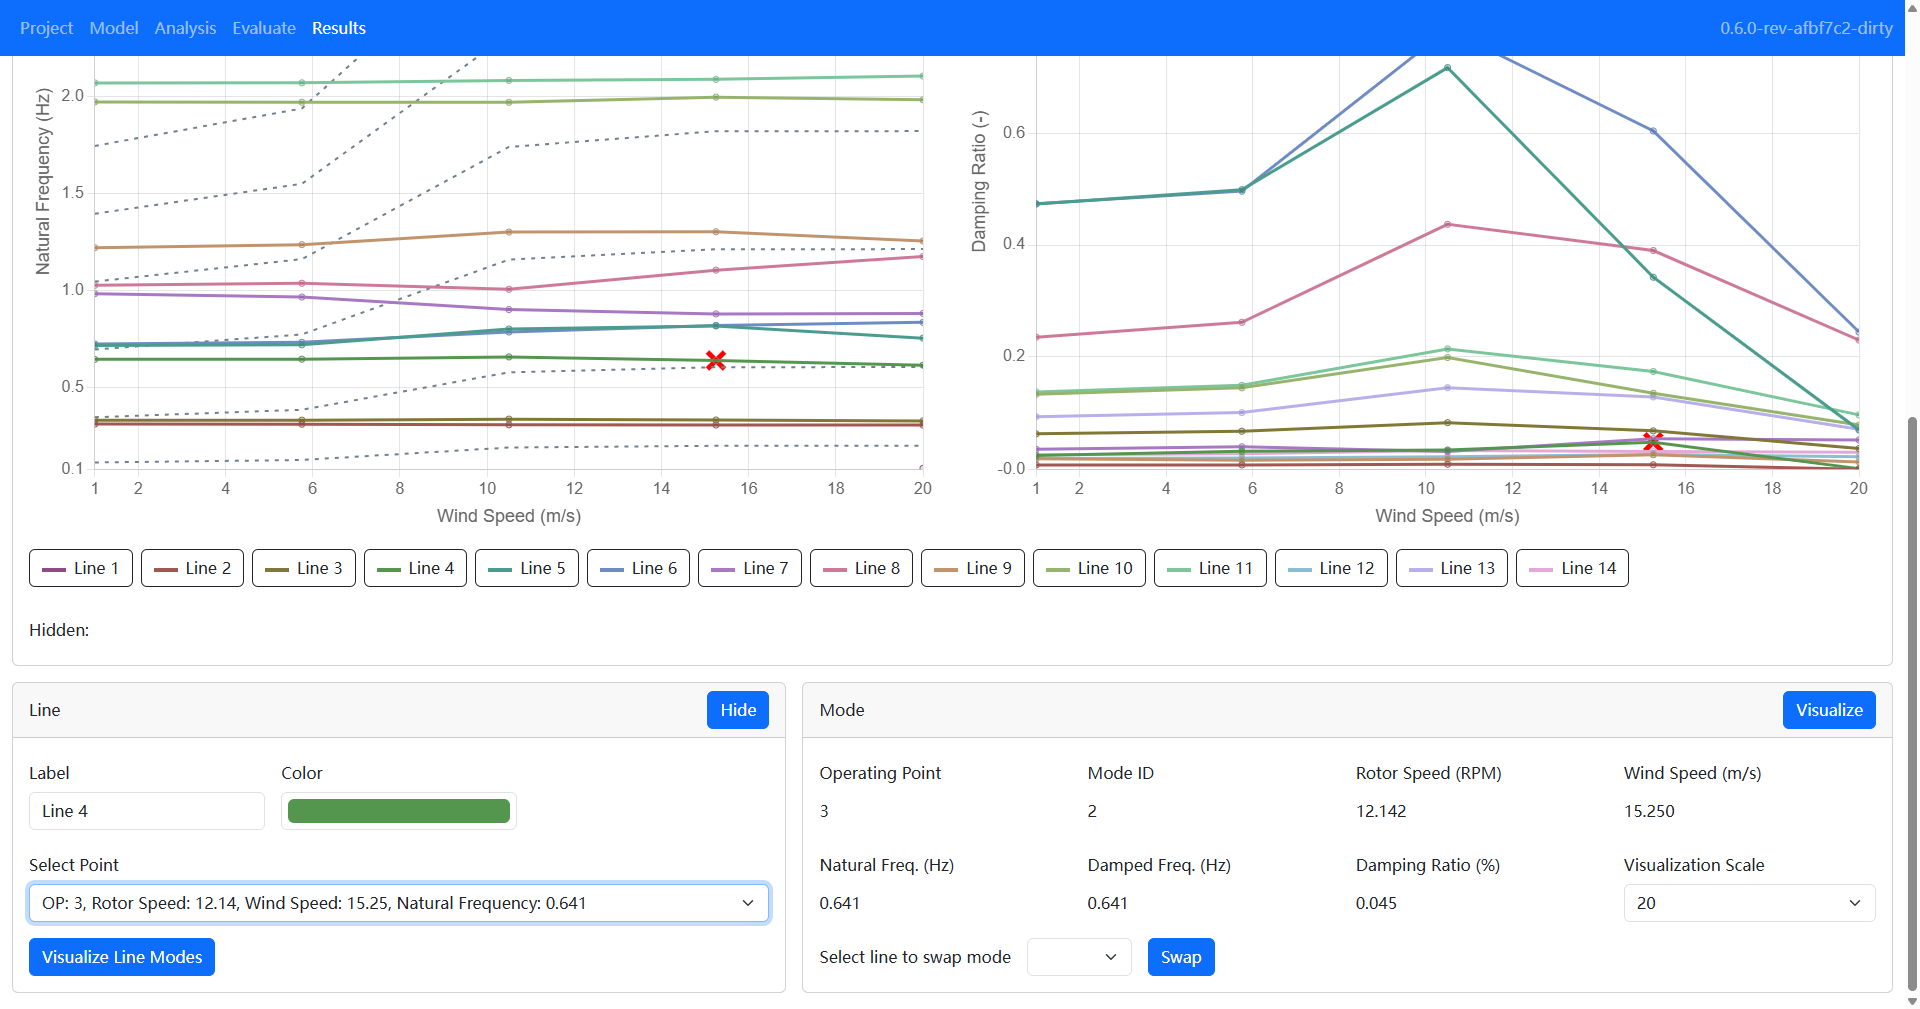
In the Campbell diagram generated by ACDC, I’ve noticed that:
- Some lines contain only one operating point (OP).
- Additionally, different points on the same line sometimes belong to different Mode ID.
This is confusing to me, as I’m not familiar with Go and cannot trace the code logic to understand how lines and modes are grouped. Could someone explain the underlying logic for grouping operating points into lines and modes in ACDC?
2. Mode Visualization and Eigenvalue Analysis
During linearization, OpenFAST generates .lin files for each case, which contain the state matrix. I’m trying to extract eigenvalues λ and eigenvectors ψ by solving the eigenvalue problem, in order to obtain natural frequencies and damping ratios. However, I’m unsure how to map the eigenvectors to the physical coordinates for mode shape visualization.
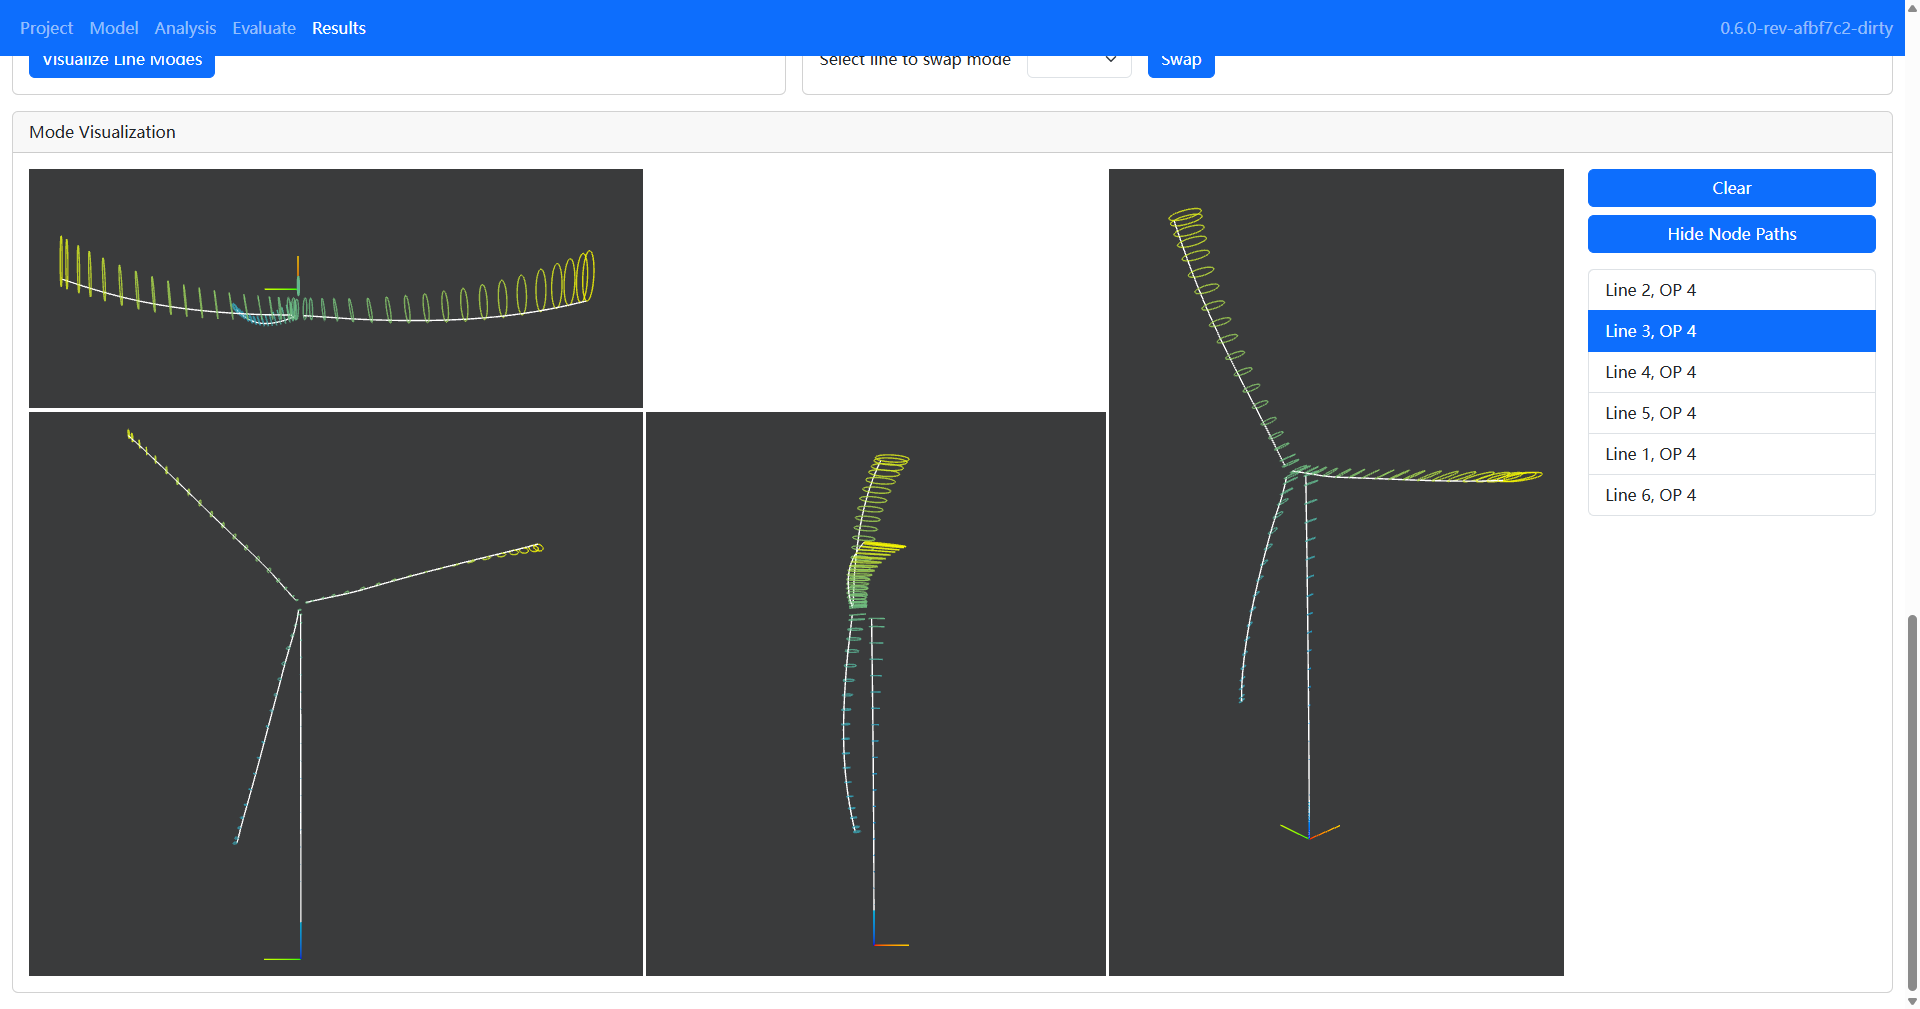
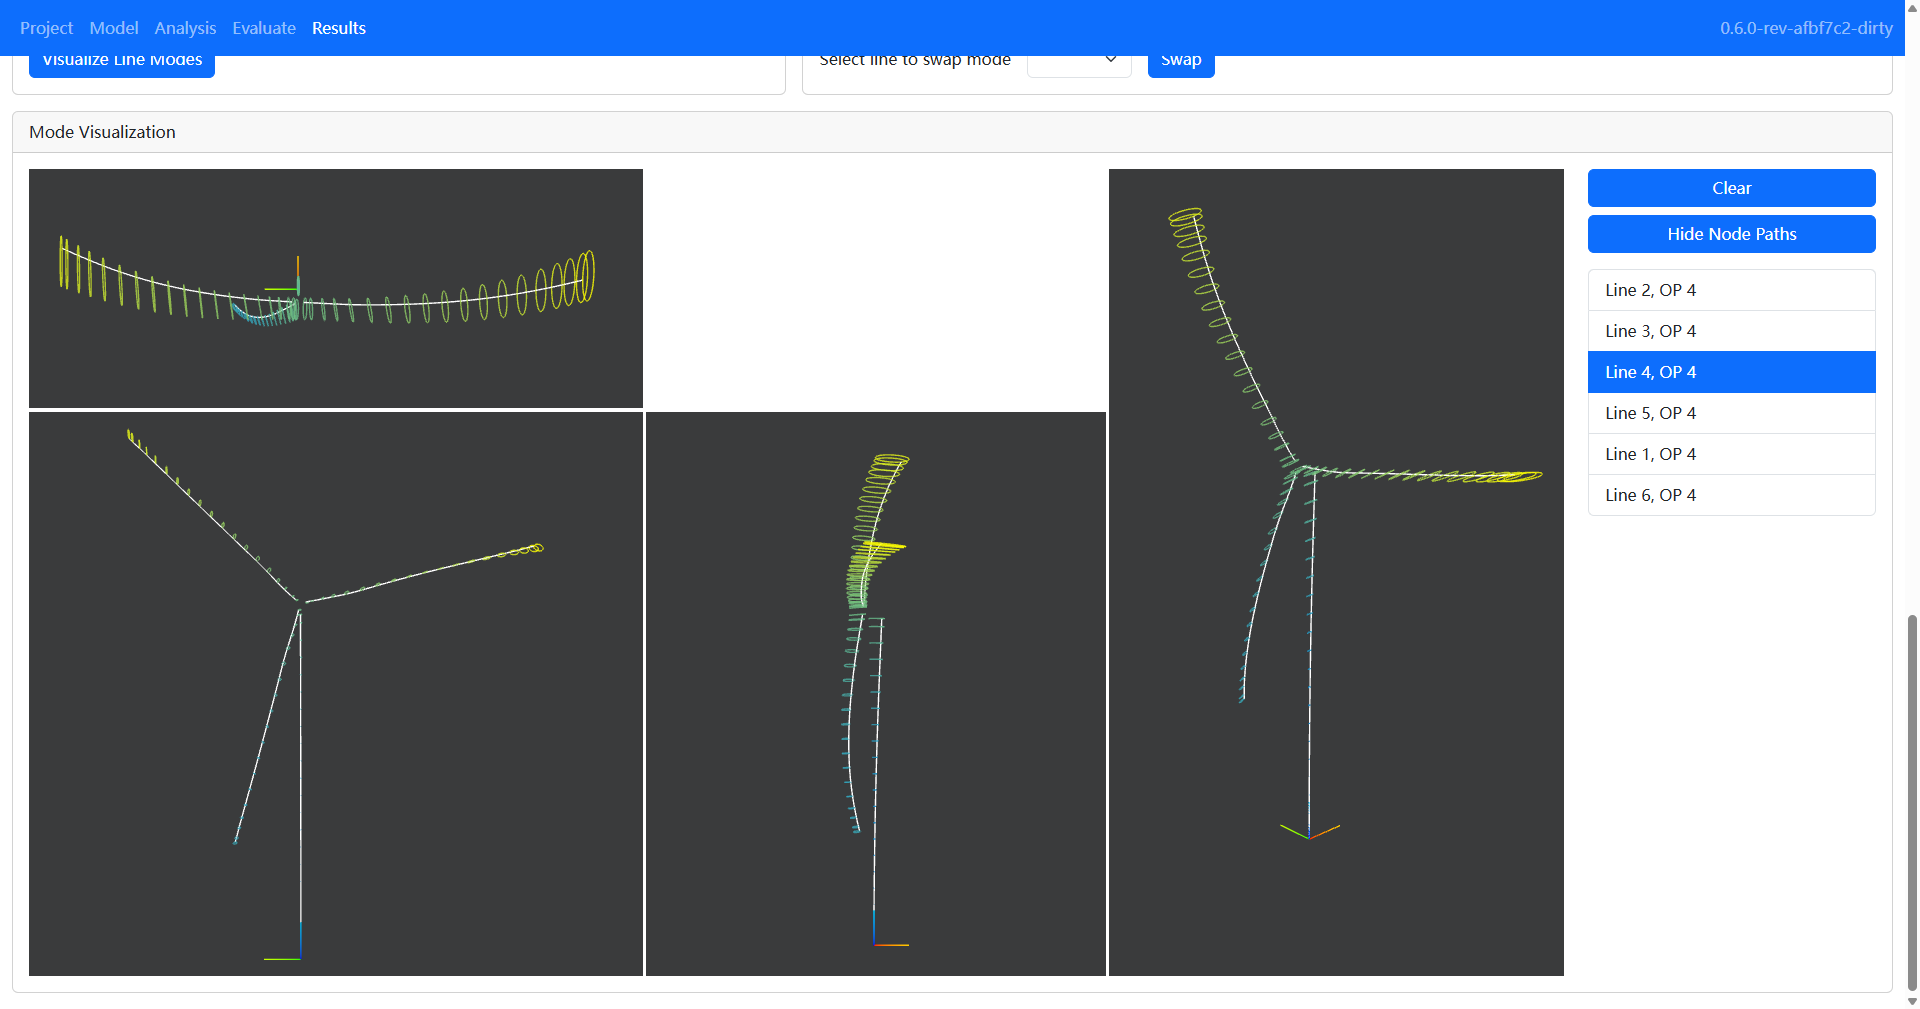
In ACDC, the Mode Visualization feature seems to handle this, but I’m not clear on how it works. In practice, I’ve also noticed that some visualization results look very similar but are classified under different modes.
For instance, here are Line 3 OP4 and Line 4 OP4
3. Comparison with Bladed Modal Analysis Results
I’m also interested in comparing OpenFAST’s modal analysis results with those from Bladed. In Bladed, I often see modes labeled as:
- Rotor 1st Flapwise Mode A, B, C, etc.
However, I’m not sure which modes in OpenFAST correspond to these. Has anyone attempted such a comparison? If so, could you share your experience or any mapping guidelines between OpenFAST and Bladed modes?
You may could refer to my former topic: https://forums.nrel.gov/t/unmapped-modes-problem-while-using-matlab-toolbox/9374.
Dear @Xingyu.Liu,
Here are my responses:
1a. I’m not sure what you mean when you say some lines contain only one OP. I see several lines in your ACDC screenshot, but all of them seem to have the same 5 OPs.
1b. ACDC uses Modal Assurance Criteria (MAC) to compare eigenvectors between OPs to try to ensure lines the correspond to the same mode for different OPs. This process is not foolproof though, which is why the user can swap modes between lines if they interpret the results differently.
2. The eigenvectors determine the contribution (magnitude, phase) of each DOF to a given mode. The visualization capability of ACDC passes these DOF magnitudes/phases through OpenFAST, which uses them to calculate displacements in physical coordinates for visualization.
3. ACDC attempts to connect lines through the same modes as a function of OP, but it does not try to label the modes. If you want these labels, you can use the visualization functionality of ACDC to determine what each mode means physically and update the labels accordingly. We have compared results from OpenFAST/ACDC against GH Bladed for different reference models, generally with good agreement.
Best regards,
Dear @Jason.Jonkman ,
Thank you for your help! here are some additional notes:
1a. You may could refer to my first image, when I select line 1, in “Select Point“ chart I could only find “OP4 Rotor Speed: 12.15…..“, and in the diagram line 1 also just has 1 point.
2. So did you mean that the visualization results of each mode are calculated by OpenFAST at Analysis stage? But I could not find any record files which visualize each mode shape. Or maybe some processes are done at Results stage by ACDC? I’m a little confused about this.
3. It seems there is currently no automated method for identifying modes. If possible, I would like to develop something to achieve this functionality.
Thank you again for your patient response and help!
All best wishes,
Dear @Xingyu.Liu,
Here are my responses:
1a. When you select a point on a given line in ACDC, you are picking a specific OP from those ran.
2. The data transfer between OpenFAST and ACDC happens in the back end without writing data to a file.
3. I think the mode shape labeling process could be automated for a given class, but is difficult when the class can vary a lot (different turbine geometries, different support structure types, different conditions like operating/idling). We found it satisfactory to connect lines between similar modes and let the user label them as they want.
Best regards,
Dear @Jason.Jonkman ,
Thank you for your responses. Indeed, mode analysis is a hard task. I checked the code for getCampbellData and identifyModes in the MATLAB toolbox (hoping that the identification principles of ACDC haven’t changed). It seems that during the process of separating modes, we assume that the various states are orthogonal. However, I’m wondering if the results might be inaccurate if the mode selection is not precise or if there is strong coupling between the modes. Do you have any suggestions?
All best wishes,
Dear @Xingyu.Liu,
I know that the mode identification approach used by the MATLAB Toolbox was not always accurate and we generally recommend when using that capability that the user double check the result through visualization. ACDC makes that overall process easier, but we skipped the process of trying to label modes due to the difficulty in automating that and the potential of misleading users.
Best regards,
1 Like
Dear @Xingyu.Liu
I’ll try to add some additional information in response to your questions:
1a. I do see the single operating point and mode on Line 1 in your first figure. This happens when that particular mode only happens at one operating point, which is unusual, or you’ve set lower and upper bounds on the frequency range in the plot.
1b. As Jason described, ACDC uses MAC to compare the similarity between all modes in adjacent operating points. Then, modes with the greatest similarity are paired between the operating points using the Hungarian algorithm. The Mode ID that’s displayed by ACDC is simply the mode identifier when a particular operating point’s modal frequencies are sorted from least to greatest. It’s normal for a line to contain modes with different IDs especially if any lines cross.
2. The physical interpretation of the rows of the eigenvector are given in OpenFAST’s .lin file in the section titled Order of continuous states. These values are tied directly to OpenFAST’s internal representation of each module’s states, so they are sometimes difficult to use outside of that context. ACDC processes the eigenvectors and re-runs OpenFAST when you click the Visualize button to generate the visualizations. OpenFAST loads the eigenvectors, scales them, applies them to existing state of the model at linearization time, calculates the new combined state of the model, and then writes the visualization VTK files. All of this occurs in the project/Case#directory adjacent to the ACDC project file you created. In there you’ll also find JSON files containing the modes of each operating point and the associated eigenvectors. Documentation for performing mode shape visualization in OpenFAST is available at 3. Working with OpenFAST — OpenFAST v4.1.2 documentation. Note, ACDC is just automating the steps in this process and loading the VTK files, OpenFAST is doing all the work. As for multiple mode shapes looking the same at the same operating point, something may have gone wrong in running the mode shape visualization and ACDC didn’t report it, so it just loaded the VTK files from the previous mode, giving the same visualization. There have been some fixes for this which will be available in the next release.
3. ACDC does not support automatic identification of the mode shapes. It is difficult to automate, not very accurate, and tends to mislead users. ACDC simplifies the visualization process so the user can interpret the mode directly. If you do develop a new method for doing this, please let us know and we’ll be happy to try it out.
I hope this helps, and thank you for using ACDC.
1 Like
Dear @Derek.Slaughter and @Jason.Jonkman ,
Thank you for your reply! Actually, I didn’t set the frequency range manually – I just adopted the default value. As for the 1b, could I assume that for ACDC, the results of the same mode are on the same line, not those with the same mode ID?
As you can see, I am a freshman in OpenFAST, and I think maybe a lot of people like me struggle with modal analysis and damping ratio analysis. So I am recently working with developing some method to help (maybe not a good idea).
Thank you again for developing OpenFAST and ACDC!
All best wishes,
Dear @Xingyu.Liu,
Regarding 1b, I agree with your summary. That is what we are saying: the same mode should be identified by ACDC with the same line, not the same mode ID.
Best regards,
1 Like