BeamDyn: The blade modal are calculated using the BeamDyn.sum file

Dear all,

I tried to use the stiffness matrix and mass matrix in BeamDyn’s.sum file to calculate the natural frequency and mode shape. After removing the first six rows and six columns of data from the K M matrix, I conducted eigenvalue analysis and got basically correct natural frequency, but did not get correct eigenvector (mode shape). The analysis results are shown in the following figure. May I ask why? beamdyn output matrix can not calculate the mode shape or my calculation method is wrong。

calculate:
python :
屏幕截图 2023-12-25 155034
DTU10MW calculation results:
The first row of data is the sorted eigenvalue, and below the eigenvalue is the corresponding eigenvector. There is only a part of the eigenvector in the screenshot, even if it is a part, it can be seen that there is no rule.

Dear @ShiXuan.Li,

The BeamDyn mass and stiffness matrices include rows and columns associated with six degrees of freedom per node (3 translations, 3 rotations). I don’t see that you are isolating the contribution of each degree of freedom to each mode.

Best regards,

Dear Jason,

Thank you very much for your quick reply. I try to understand what you mean by “isolating the contribution of each degree of freedom to each mode”. My understanding is that the first order flapping mode shape corresponds to the number at the k*6+1 position of the eigenvector. There seems to be some mistake in my understanding. I hope you can answer my doubts.

Best regards,

Dear @ShiXuan.Li,

Due to structural pretwist and possible composite coupling, the flap mode may have contributions from all BeamDyn degrees of freedom. But I agree that you should separate out each DOF to visualize the modes correctly, i.e., (n-1)*6+1 for translation in x, (n-1)*6+2 for translation in y, … (n-1)*6+6 for rotation about z for n = 1, 2, 3, order_elem.

Best regards,

Dear Jason,

I have processed the feature vector according to the method you mentioned. The following figure shows the result after separation of thefeature vector of the first order flapping mode. It is obvious that x contributes the most, but I don’t understand why the vector after separation increases first and shouldn’t it keep increasing? I hope you can answer my doubts. Sorry to bother you again.

Best regards,

Dear @ShiXuan.Li,

Can you share plots of the translational and rotational displacements of this mode as a function of distance along the blade? It has hard for me to visualize based on the values alone.

Best regards,

Dear Jason,

The number of gll-nodes of beamdyn is order_elem + 1,and the size of the mass and stiffness matrix in the beamdyn.sum file is ((order_elem + 1) *6)×((order_elem + 1) *6). In my opinion, the position of gll-nodes is the distribution of nodes along the expansion items of blades. If this view is correct, then “plots of the translational and rotational displacements of this mode as a function of distance along the blade” is shown as the following figure.

NREL5MW 1th mode shape:
x y z rx ry rz
-0.000032 0.000004 0.000000 -0.000007 -0.000064 -0.000000
-0.000471 0.000064 0.000000 -0.000064 -0.000467 -0.000003
-0.001848 0.000255 0.000000 -0.000102 -0.000910 -0.000006
-0.004366 0.000643 0.000001 -0.000174 -0.001412 -0.000010
-0.013838 0.002126 0.000003 -0.000267 -0.002527 -0.000019
-0.034071 0.005396 0.000007 -0.000255 -0.003237 -0.000034
-0.064369 0.010441 0.000013 -0.000427 -0.003796 -0.000044
-0.122382 0.020024 0.000025 -0.000736 -0.004574 -0.000057
-0.194629 0.031655 0.000040 -0.000923 -0.004136 -0.000061
-0.270436 0.043168 0.000055 -0.001006 -0.003048 -0.000058
-0.344882 0.053281 0.000068 -0.001041 -0.002213 -0.000055
-0.378063 0.055810 0.000071 -0.000994 -0.001501 -0.000049
-0.408673 0.057052 0.000072 -0.001009 -0.001070 -0.000048
-0.402340 0.053052 0.000067 -0.000795 -0.000836 -0.000035
-0.337025 0.042313 0.000054 -0.000575 -0.000506 -0.000023
-0.298531 0.036069 0.000046 -0.000416 -0.000351 -0.000015
-0.197735 0.023239 0.000029 -0.000176 -0.000174 -0.000006
-0.122672 0.014161 0.000018 -0.000062 -0.000059 -0.000002
-0.038547 0.004402 0.000006 -0.000013 -0.000006 -0.000000
-0.000547 0.000063 0.000000 0.000000 -0.000000 0.000000
1th

Best regards,

Dear @ShiXuan.Li,

From these plots, it looks like the root is cantilevered and the tip is pinned. Did you eliminate the rows and columns of the mass and stiffness matrices only of the root node?

What order_elem are you using; presumably 20? It sounds like you are using quadrature = 1 (Gaussian); can you confirm?

Best regards,

Dear Jason,

Yeah, I just eliminated the first six rows and the first six columns of the matrix.

parameter:
quadrature = 2(Trapezoidal )
order_elem = 20

order_elem = 20, so the number of nodes is 21, the size of the mass and stiffness matrix in the sum file is 126×126, and the size of the matrix I used for eigenvalue analysis is 120×120.

Best regards,

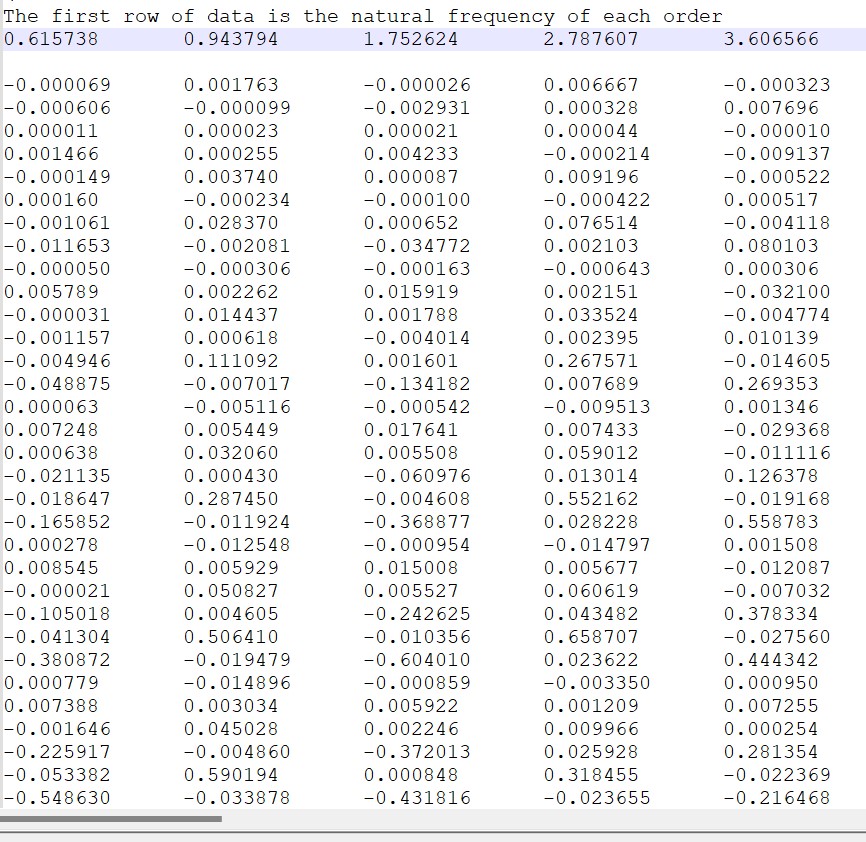
I think the issue with the mode shapes is the calculation of the matrix that is being used for the eigenanalysis. The OP gives mat = np.dot(K_6, np.linalg.inv(M_6)) where it should be mat = np.dot(np.linalg.inv(M_6), K_6). However, I would recommend using the scipy.linalg.eig function which supports specifying the A and B matrices to solve the generalized eigenvalue problem (e.g. scipy.linalg.eig(K, M)). The following is the complete code to calculate and plot the mode shapes for the BeamDyn based NREL 5MW blade as generated by the BeamDyn driver, followed by the plot it produces:

import numpy as np
import yaml
import matplotlib.pylab as plt

data = yaml.load(open("bd_driver.BD.sum.yaml"), Loader=yaml.Loader)

x = np.array(data["Init_Nodes_E1"])[1:, 2]

K_BD = np.array(data["K_IEC"])
M_BD = np.array(data["M_IEC"])
# eigval, eigvec = scipy.linalg.eig(K_BD[6:,6:], M_BD[6:,6:])
eigval, eigvec = np.linalg.eig(np.dot(np.linalg.inv(M_BD[6:, 6:]), K_BD[6:, 6:]))
idx = np.argsort(eigval)
freq = np.sqrt(eigval[idx]) / 2 / np.pi
shapes = eigvec[:, idx]

fig, ax = plt.subplots(6, figsize=(5, 9), sharex=True)

for i in range(3):
    ax[0].plot(x, shapes[0::6, i], label=f"Mode {i+1}")
    ax[1].plot(x, shapes[1::6, i], label=f"Mode {i+1}")
    ax[2].plot(x, shapes[2::6, i], label=f"Mode {i+1}")
    ax[3].plot(x, shapes[3::6, i], label=f"Mode {i+1}")
    ax[4].plot(x, shapes[4::6, i], label=f"Mode {i+1}")
    ax[5].plot(x, shapes[5::6, i], label=f"Mode {i+1}")

ax[0].set_ylabel("UX")
ax[1].set_ylabel("UY")
ax[2].set_ylabel("UZ")
ax[3].set_ylabel("RX")
ax[4].set_ylabel("RY")
ax[5].set_ylabel("RZ")
ax[-1].set_xlabel('blade loc (m)')

plt.tight_layout()
fig.align_ylabels(ax)

Please give this a try and let us know if you get reasonable mode shapes. Thanks!

2 Likes