Dear Bartosz,
As you’ve likely noticed, the RNA in ElastoDyn is modeled simply, with only a few user inputs in terms of the nacelle mass (NacMass) and yaw inertia (NacYIner), the hub mass (HubMass) and rotational inertia (HubIner) and generator rotational inertia (GenIner). So, NacMass should represent any mass in the RNA not considered in the blades or the hub. And NacYIner should include any nacelle-yaw inertia that is associated NacMass (not including HubMass). And HubIner should include rotational inertia about the shaft that is associated with HubMass.
The total rotational inertia of the rotor and drivetrain should be reflected in the distributed blade mass, HubIner, and GenIner. So, GenIner should include any rotational inertia of the drivetrain (expressed relative to the high-speed shaft if there is a gearbox) not accounted for in HubIner.
Best regards,
Dear Jason,
I have successfully modeled the turbine using CAD and FEM for masses and inertias and the rigid body matrix is now in agreement with the data I had from the real Hywind Scotland turbine. The error is within 0.1% So I am very happy! But it was a long process!
I have very good agreement in the eigenperiods only 4 seconds difference for surge and sway- 92 for my model against 96 in the data. The other periods are like within 0.2 seconds! This just great!
I just wanted to say thank you for your help!
Realizing I had divided the zero and infinity added masses with g helped too.  .
.
Thank you again!
Now I’ll check my improved model on the test cases!
Best Regards,
BS
Dear Jason,
I have another problem I’d like to ask you to comment on.
As I wrote above, if I use the mooring matrix for the equilibrium condition supplied in my data from ORE Catapult I have very good agreement in eigenperiods. Here is the matrix:
However as I am unable to set MAP to replicate the above matrix in the zero displacement condition.
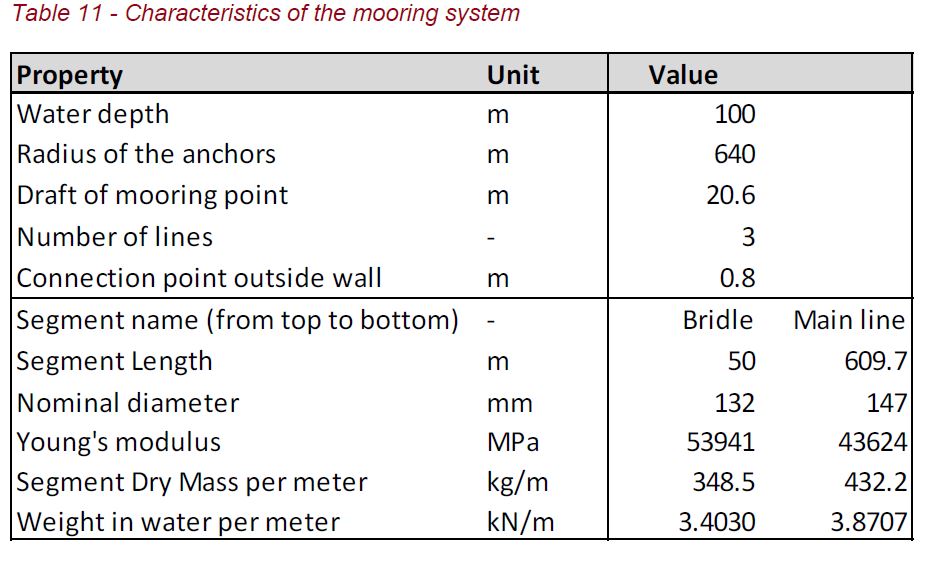
Here is the mooring description I have:
The diameter of the Spar is 14.4 so the fairlead should be on a circle of 8m diameter and this is how I located it in input file:
I obtained the line stiffnesses simply by multiplying the Youngs modulus from the table above with a circular section area of the diameter also from the table.
CONT.
The resulting restoring mooring matrix I obtained using the python driver for the setup above is:
Could you please comment if this is normal?
I thought I could at least have the same mooring restoring in the equilibrium condition and similar eigenperiods for small displacement from this initial position, but I have great difficulty to adjust anything in the MAP input to even come close to the response I am getting with the restoring set to mimic the matrix from previous post(there CompMooring=0 and the matrix is in the AddCLin section of Hydrodyn).
CONT.2
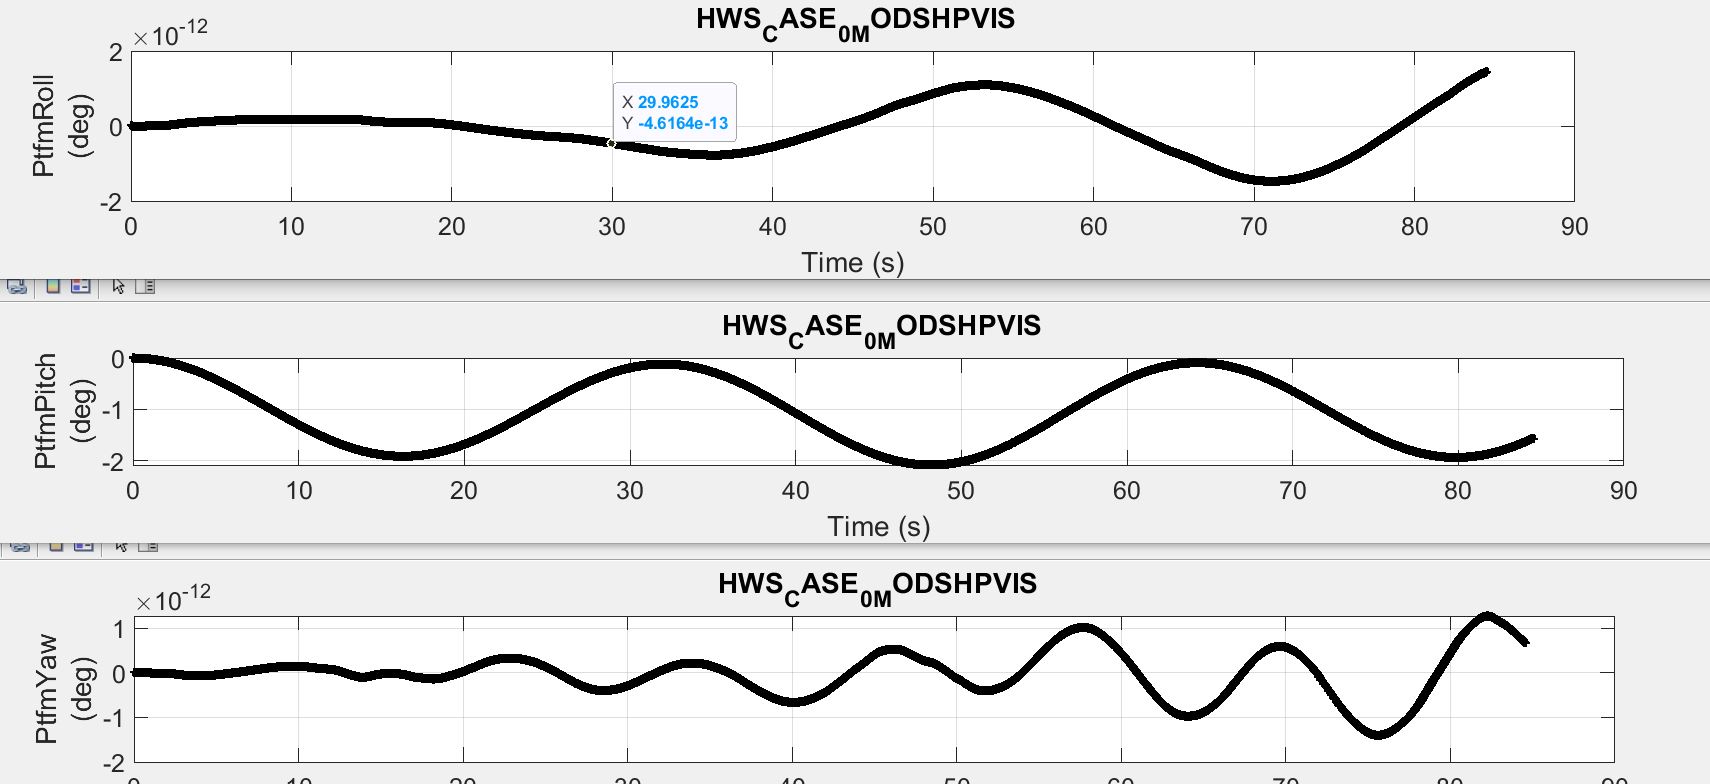
These are the “right” responses, I get with linear matrix only:
Translations
Rotations:
…
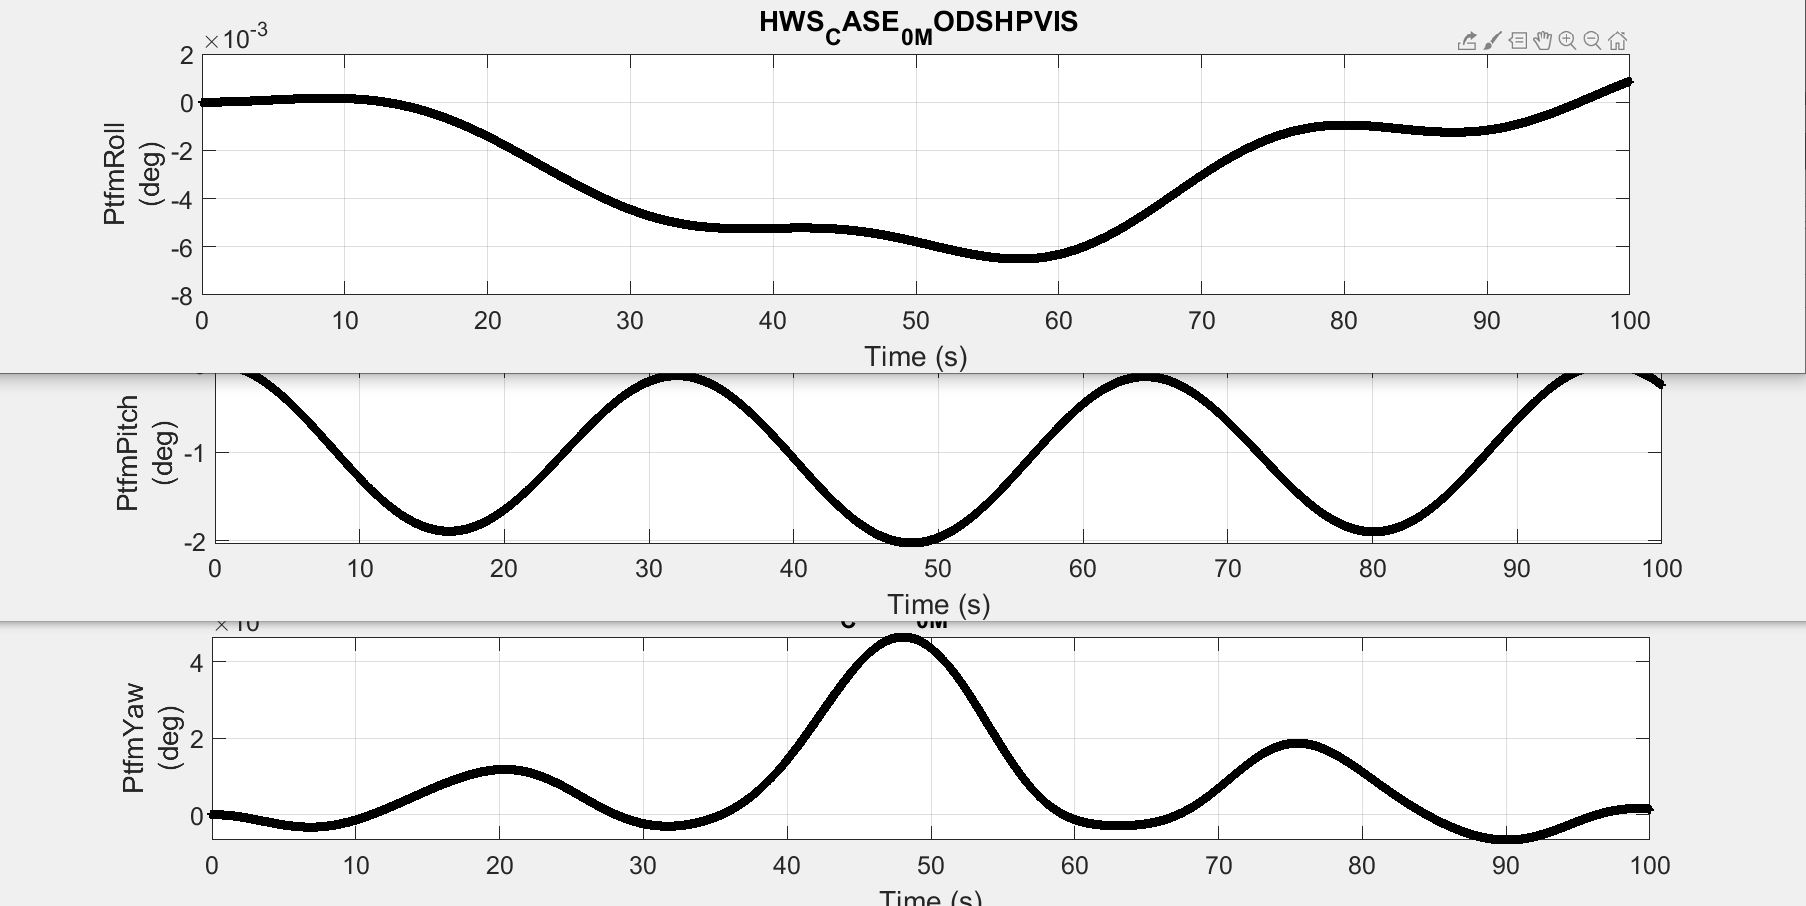
And the ones i get with the MAP:
Translations:
Rotations:
Can you give me any advice on how to tune MAP in order to have similar response at least in the beginning of the simulation. Or is it impossible, because of the couplings an nonlinearities?
Best Regards,
BS
Dear Bartosz,
I would say the 6x6 stiffness matrix you are getting from the Python wrapper to MAP++ is actually quite close to the matrix reported by ORE Catapult. While not exact, the principal values (the diagonal elements and surge/pitch coupling and sway/roll coupling) are quite close.
I did notice one anomaly in the MAP++ inputs. In MAP++, the weight in water is derived from the mass per unit length and the line diameter (for calculating buoyancy, i.e.:
Weight in water = Gravity*( MassDenInAir - WtrDenspiDiam^2/4 )
Doing the math using your inputs, I calculate:
Weight in water for the bridle = 3.28 kN/m
Weight in water for the main line = 4.07 kN/m
which are bit different than reported in your table. These differences could explain why the 6x6 stiffness matrix differs a bit.
But some of your time series are quite a bit different, which I’m not sure I know how to explain.
Best regards,
Dear Jason,
Well spotted! It had me thinking as well.
the graphs from previous posts are not very good I agree. Ill try to generate better ones.
Thank you for your comment!
Regards
BS
Dear Jason,
I have now found the reason for the wild oscillations from the beginning of this thread. It was actually my output from NEMOH that was not formatted properly. The file .3 with Xi excitation forces contained only the magnitude and phase, instead of the magnitude, phase real and imaginary parts of Xi.
Funny enough it resulted in a complete rebuild of my model 
I guess it is now more accurate and I feel much more confident about the results.
Thanks for your help
Regards,
BS
Dear Jason,
I have another question concerning the mooring stiffness matrix (I call it KM) that I was trying to match to with MAP:
In my data description document from Equinor it says that this mooring matrix is given “relative to the waterline”, so I think it is around the platform reference point xi=yi=zi=0. Could you please comment on the reason for negative elements in that matrix for KM(1,4), and KM(4,1)?
Is this related to the fact that the point about which the whole turbine rotates is not the platform reference point?
Best Regards,
BS
Dear Bartsoz,
The off-diagonal terms come from the fact that the mooring line fairleads are not placed at (0,0,0). So, the force caused by translation will result in moment; likewise rotation will cause a force. The sign is based on the coordinate system with surge-pitch coupling the opposite sign (but similar magnitude) as the sway-roll coupling.
Best regards,
Dear Jason,
Thank you for your explanation!
it was really hard to convince my supervisor that there could be negative restoring present but eventually, he agreed. If the platform is displaced in surge it will pitch but the large restoring in pitch makes the system stable overall.
These things are clear to me but for my final presentation, I would like to be able to show this in a video.
I have 2 questions
- As I have now successfully generated all the mode shapes visualizations for my turbine I thought I could use that. However, I would like to ask you if you know a way to get the location of the point about which the turbine is rotating when pitching and rolling?
I mean, if I can generate the mode shapes, is there a mathematical formula, or condition to get the centre of rotation somehow from the linearization output or somewhere else?
- I remember being able to modify the vtk source code on Linux in order to have the exact shape of the tower from my simulation in the vtk output files. And I still have that version of the code. However, since I changed to windows, I have been using the executables of OpenFAST or I was building it with VisualStudio. Any time I include my changes and try to build with visual studio, the source code is kind of refreshing to the original form. I guess this is the OpenFAST registry doing this.
How can I suppress this and still use the convenient VS build solutions?
Regards,
BS
Dear Bartosz,
Regarding (1), the center of rotation of the floating wind system is not directly output by OpenFAST, but can be calculated through knowledge of the platform motions (e.g., seeing how the support structure displacement varies along the support structure). But it is possible that center of rotation changes over time and is different for rotations about X, Y, and Z.
Regarding (2), I’m not sure I understand what problem you are facing, but the OpenFAST registry will only generate the *_Types.f90 files; it will not write any other source code. So, you should never change the *_Types.f90 files manually, but instead, change the corresponding registry input files, *_Registry.txt.
Best regards,
Dear Jason,
Thank you very much for your suggestions. They were very helpful.
I’d like to ask another questions:
I have a rather good agreement in all of the platform motions in terms of the mean values, and their amplitudes seem to be similar to the measurements for all platform DOFs except the mean Surge displacement.
So far I have been using first-order waves in simulations. Could the use of second-order waves change the mean values for surge displacement a lot for a hywind spar model?
I am considering cases where the waves and wind propagate along the xi axis and along one of the three mooring lines like in the OC3Hywind model.
PS:
Thank you very much for sending me the Unofficial FAST Theory Manual!
do you mind if I forward it to two other OpenFAST users I’m in contact with?
Best Regards,
Bartosz
Dear Bartosz,
The second-order difference-frequency solution can cause both mean and low-frequency loading of the structure, resulting in both mean-drift and slow-drift response. But I don’t recall seeing much second-order difference-frequency response on the Hywind spar due to the low level of loading.
PS – No problem if you want to share the Unofficial FAST Theory Manual with others.
Best regards,